TNT : Troll or Not Troll
Problem statement
The problem we try to address in this project is to classify a tweet as a either a Troll or an Organic Tweet.
So let's get started by defining what we define both of them.
Troll
We define troll as a opinion manipulating tweet that is posted by a malicious user for the sole intention of swinging the election results in favor or against a particular party.
Organic Tweet?
Any tweet that is not a troll is a genuine / generic of organic tweet.
Motivation
- There are many popular cases where people are paid to make a post on public forums in order to change opinions of people in favour or against a particular party.
- One such popular example is Russian Troll Factory. In this case many people were paid to tweet on the subject of US Presidential Election 2016 which were about to happen at that time.
- We wanted to see if we can classify if a particular tweet as a paid opinion manipulating tweet or not.

Data Collection
Collecting Trolls
- Twitter identified the accounts of the users who were actually involved in the swinging the election results and deleted them.
- The tweets posted by these accounts are contained in a dataset posted on Kaggle. We use this dataset of Russian Troll Tweets as the promoted election tweets.
Collecting Organic Tweets
- We identified the most trending / used hastags in the dataset of Trolls.
- We defined most popular hashtags used in Russian Troll Tweets as the hashtags covering over 90% tweets.
- Using these hashtags (most popular hashtags) we fetch all the tweets that were posted
- In USA
- During the year 2016
- Contained atleast 1 most trending hashtag.
- The organic tweets that were fetched did not contain any user information except the screen-name.
- We retrieved all the data for the user for each of the tweet via Twitter REST API and the screen-name.
- We then remove the tweets that are in already present in Russian Troll Tweets. So now, this part of dataset comprised of only Organic tweets.
 |
| Most popular hash-tags |
This above is the word cloud of most popular hash-tags that were used in the Russian Troll Tweets.
Data cleaning and preprocessing
- All the data preprocessing and cleaning comprising of: tokenizing, handling emojis urls etc was done.
- We used word2vec model to transform the data from text space to a 200 dimensional space of vectors.
- The model trained on Twitter’s (2B tweets, 27B tokens, 1.2M vocab, uncased) was used.
- Made a vector of the entire tweet to capture the tweet intent.
- This vector will be used for further analysis of the tweet.
Features Used
Tweet features
- Text (200 dimensional tweet text vector)
User features (5 dimensional)
- Follower count
- Status count
- Friend count
- Favourites count
- Listed count
Processed json structure of an individual tweet
[{
‘tweet_text’ : ‘....’,
‘label’ : 0,
‘tweet_features’ : [ ......... ],
‘tweet_data’ :
{
….
}
‘user_data’ :
{
…...
}
}]
Data study
# What was the amount of tweets posted from individual accounts?

Result: Above is graph of top 10 users who have tweeted the most inorganic tweets.
 Result: We can see from the chart that no such correlation exists! Most users have very low tweet counts but their followers range from very few to numerous!
# Do a larger number of tweets mean higher number of followers?

# We then tried to analyse the creation date of the accounts used for trolling.

Result: Most troll accounts were created in the second half of 2013 or first half of 2014!
Classification
Neural Network Architecture:

FC(210, 150) → ReLU → FC(150, 150) → ReLU → FC(150, 100) → ReLU → FC(100, 100) → ReLU → FC(100, 50) → ReLU → FC(50, 10) → ReLU → FC(10, 2) → Sigmoid

Results and Accuracy

- By using only the textual features we tried classification using the specified neural network.
Inference: We can clearly see the classifier performs fairly just by using only text features
- Then we tried using both Text + User features.
Inference: We can see that just by adding 5 features of the user the classifier is able to classify using a near perfect accuracy Which means that user features must play a pivotal role in the classification.
- Then we tried to see how well the user feature alone would do.
Inference: As we can clearly see, just by using the user features only we classify near-perfectly So we claim that we only need User features only for the classification.

User Features vs Text Features
From the previous experiments we can see that the classification is heavily weighted by the user features. Now to see why our classifier was able to perform very well in the Text+User experiment we did feature analysis.
We via using t-sne feature compression converted 205 feature vector to 3 dimensional vector. Here is a scatter plot of the samples.
We via using t-sne feature compression converted 205 feature vector to 3 dimensional vector. Here is a scatter plot of the samples.
 |
| User+Text t-sne plot |
Lets see for the Only User case: We perform same feature analysis as in the previous case and convert the 5 dimensional feature vector to 3 dimensional feature vector. Here is a scatter plot of the samples
 |
| User tSNE plot |
We here can clearly see that the classifier just have to learn a linear classifier in this case and hence we get a good accuracy. So we can clearly see that there is simple boundary which the neural network will learn easily and hence the results are well supported.
Ablation Study
We now analyse the trends of individual features. Following are graphs of the probability distribution functions of the individual user features.
 |
| Friends count |
 | |
|
 |
| Listed count |
 |
| Status count |
 |
| Favoirites count |
We can clearly see that in 4 out 5 cases the inorganic samples are clustered around the center. So we can say that there is a clear trend in the tweets but they are is not simply classifiable via only the a subset of above features. So the neural network must have learned a composite function of all these features.
Similar behavior can be seen when try to train on individual features.
 |
| Loss vs epochs on different individual features |
As we can clearly see, if we use single features then the loss is barely able to get below 500. But as we add features one by one we can see that when we use all 5 features the loss goes down to nearly 0.

Conclusion
- The conclusion of the study is that the user features tend to heavily dominate over the text features for the purpose of classification.
- This makes sense because a opinion manipulating tweet can be posted by anybody, be it a normal user or a genuine paid troller.
- But we can differentiate them using only the user information like status counts listed count, follower count because these are the features that cannot be faked easily.
- We also created a demo in which we could classify a tweet as organic or inorganic(troll) using all three combination of features.
We made a web interface for the project in which we can enter tweet url or tweet text to see how likely it is to be a troll.

Study 2 : Studying the use of trending hashtags to popularizing tweets
Motivation
- Trending hashtags serve as a great way be make yourself exposed to a whole lot of user base.
- Users generally tend to use these trending hashtags to make their tweets more popular.
- A particular trending hashtag might be used by users to popularize a wide spectrum of tweets.
- But it might happen that a particular hashtag is more exploited by a particular class of tweets than by others.
- A particular hashtag might be used more for promoting let’s say religious propaganda than advertising a product and vice versa.
Data Collection
- We got the dataset containing trending hashtags in 2013.
- Got the ids of the tweets using these hashtags.
- Fetched the tweets corresponding to the tweet ids.
- We fetched the tweets of 4 different elections in the year 2013.
- New York City Mayoral Election’13
- Bangladesh Presidential Election’13
- Malaysia General Election’13
- Pakistan Election’13
- We extracted all the hashtags that these tweets used. We compared the total number of hashtags used in these tweets to the number of hashtags that were trending at that time.
- We tried to do a pilot study and see how much people tend to use it.
- We choose elections as our study model.
Reasons:
Elections become very popular on social media.
Election propaganda might make use of such hashtags to manipulate the general users.
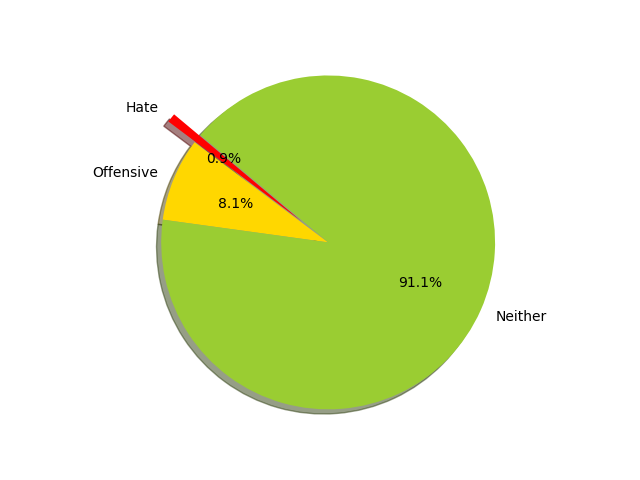
 |
| NYC Mayoral Elections |
 |
| LA Mayoral Elections |
Inference
- Elections become very popular on social media.
- Trolls generally don’t use random trending hashtags, out of context, to sway opinions or for personal benefit. (malicious intent)
- Such trolls use hashtags within the particular topic for malicious intent.
Video Explanation for the project.
Links


References
- Supervised machine learning for the detection of troll profiles in twitter social network: application to a real case of cyberbullying
- Analyzing and Mining Comments and Comment Ratings on the Social Web
- Do Not Feel The Trolls
- Finding Opinion Manipulation Trolls in News Community Forums
- Early detection of promoted campaigns on social media
- Detection of Promoted Social Media Campaigns

Comments
Post a Comment